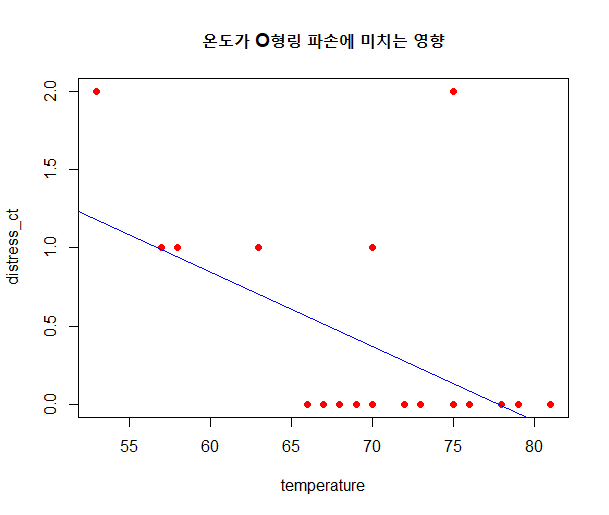
Netflix Movies and TV Shows

Movies and TV Shows listings on Netflix

www.kaggle.com


넷플릭스 데이터는 어떻게 구성되어 있는가?

더보기
# Anaconda Prompt (anaconda3) : pip install  plotly

import plotly.graph_objects as go
from plotly.offline import init_notebook_mode, iplot
import pandas as pd
from plotly.subplots import make_subplots

df = pd.read_csv("c:/data/netflix_titles.csv")
df


넷플릭스에 있는 TV Show와 영화 비율

더보기
# September 9, 2019 형식을 모두 숫자 형식으로 변환해줌
df["date_added"] = pd.to_datetime(df['date_added'])

# type : 영화 / TV Show
col = 'type'
grouped = df[col].value_counts().reset_index()
grouped = grouped.rename(columns={col:"count","index":col})

# plot
trace = go.Pie(labels=grouped[col], values=grouped['count'], pull=[0.05,0],marker=dict(colors=['brown','cornflowerblue']))
layout = go.Layout(title=" ",height=400,legend=dict(x=0.1,y=1.1))
fig = go.Figure(data = [trace],layout=layout)
iplot(fig)

영화가 거의 70% TV가 30%


넷플릭스 컨텐츠 추가 추세 (선 그래프)

더보기
d1 = df[df["type"]=="TV Show"]
d2 = df[df["type"]=="Movie"]

# 년도만 사용
vc1 = d1["date_added"].dt.year.value_counts().reset_index()
vc1.columns = ['year','count']
vc1['percent'] = vc1['count'].apply(lambda x : 100*x/sum(vc1['count']))
vc1 = vc1.sort_values('year')

vc2 = d2["date_added"].dt.year.value_counts().reset_index()
vc2.columns = ['year','count']
vc2['percent'] = vc2['count'].apply(lambda x : 100*x/sum(vc2['count']))
vc2 = vc2.sort_values('year')

trace1 = go.Scatter(x=vc1['year'], y=vc1["count"],name="TV Shows",marker=dict(color='cornflowerblue'))
trace2 = go.Scatter(x=vc2['year'], y=vc2['count'],name="Movie",marker=dict(color='brown'))
data = [trace1,trace2]

layout = go.Layout(title="넷플릭스 컨텐츠 추가 증가 추세",legend=dict(x=0.1,y=1.1,orientation="h"))
fig = go.Figure(data,layout=layout)
fig.show()

20년도는... 데이터가 얼마 없으니.. 무시하고... 계속 증가하는 추세다.. 이말입니다...


넷플릭스 컨텐츠 추가 추세 (막대 그래프)

더보기
vc1 = d1["date_added"].dt.year.value_counts().reset_index()
vc1.columns = ['year','count']
vc1['percent'] = vc1['count'].apply(lambda x : 100*x/sum(vc1['count']))
vc1 = vc1.sort_values('year')

vc2 = d2["date_added"].dt.year.value_counts().reset_index()
vc2.columns = ['year','count']
vc2['percent'] = vc2['count'].apply(lambda x : 100*x/sum(vc2['count']))
vc2 = vc2.sort_values('year')

bar1 = go.Bar(x=vc1['year'],y=vc1['count'],name="TV Shows",marker=dict(color='cornflowerblue'))
bar2 = go.Bar(x=vc2['year'],y=vc2['count'],name='Movies',marker=dict(color='brown'))

data = [bar1,bar2]

layout = go.Layout(title="막대그래프로 보는 넷플릭스 컨텐츠 추가 증가 추세", legend=dict(x=0.1,y=1.1,orientation="h"))
fig = go.Figure(data,layout=layout)
fig.show()

점점 증가하고 있군요... 넷플릭스 힘 줘!!!! 나 넘 즐겁게 보고 있다고~! 모던 패밀리 마지막 시즌 언제 올려줄거야ㅠ


넷플릭스 컨텐츠 추가 추세 (PIE 그래프)

더보기
df['year_added'] = df['date_added'].dt.year
k = round(df.groupby('year_added')['type'].value_counts(normalize=True)*100)
print(k)
k.reset_index(name='percent(%)')

d1 = df[df["type"]=="TV Show"]
d2 = df[df["type"]=="Movie"]
date = d1['date_added'].dt.year.value_counts().reset_index()
date2 = d2['date_added'].dt.year.value_counts().reset_index()

result = pd.merge(date,date2,how='outer',on='index').sort_values(by=['index'],ascending=False)
result.columns = ['year','TV Show','Movie']
result.index=[i for i in range(len(result))]

result
data0 = {"values" : (result["TV Show"][0],result["Movie"][0]),
         "labels" : ("TV Show","Movie"),
         "domain" : {"row" : 0 , "column" : 0},
         "name" : result["year"][0],
         "hoverinfo" : "label+value+name",
         "hole" : .4,
         "type" : "pie"
        }

data1 = {"values" : (result["TV Show"][1],result["Movie"][1]),
         "labels" : ("TV Show","Movie"),
         "domain" : {"row" : 1 , "column" : 0},
         "name" : result["year"][1],
         "hoverinfo" : "label+value+name",
         "hole" : .4,
         "type" : "pie"
        }

data2 = {"values" : (result["TV Show"][2],result["Movie"][2]),
         "labels" : ("TV Show","Movie"),
         "domain" : {"row" : 2 , "column" : 0},
         "name" : result["year"][2],
         "hoverinfo" : "label+value+name",
         "hole" : .4,
         "type" : "pie"
        }

data3 = {"values" : (result["TV Show"][3],result["Movie"][3]),
         "labels" : ("TV Show","Movie"),
         "domain" : {"row" : 0 , "column" : 1},
         "name" : result["year"][3],
         "hoverinfo" : "label+value+name",
         "hole" : .4,
         "type" : "pie"
        }

data4 = {"values" : (result["TV Show"][4],result["Movie"][4]),
         "labels" : ("TV Show","Movie"),
         "domain" : {"row" : 1 , "column" : 1},
         "name" : result["year"][4],
         "hoverinfo" : "label+value+name",
         "hole" : .4,
         "type" : "pie"
        }

data5 = {"values" : (result["TV Show"][5],result["Movie"][5]),
         "labels" : ("TV Show","Movie"),
         "domain" : {"row" : 2 , "column" : 1},
         "name" : result["year"][5],
         "hoverinfo" : "label+value+name",
         "hole" : .4,
         "type" : "pie"
        }


data = [data0,data1,data2,data3,data4,data5]

layout = go.Layout({
    "title" : "2015~2020 type 비율 시각화",
    "grid" : {"rows" : 3, "columns" : 2}
})

fig = go.Figure(data=data,layout=layout)
iplot(fig)

압도적으로 높은 영화 추가량


TV Show, 영화 발매 증가 추세

더보기
vc1 = d1["release_year"].value_counts().reset_index()
vc1.columns = ['release_year','count']
# vc1['release_year'][21] = "under_1990"
# vc1['count'][21] = vc1.iloc[-21:-1,].sum()[1]
vc1 = vc1.sort_values('release_year',ascending=False)
vc1 = vc1.iloc[1:21,] # 1997년(netflix 설립일) ~ 2019년까지

vc2 = d2["release_year"].value_counts().reset_index()
vc2.columns = ['release_year','count']
vc2 = vc2.sort_values('release_year',ascending=False)
vc2 = vc2.iloc[1:21,]

bar1 = go.Bar(x=vc1['release_year'],y=vc1['count'],name="TV Shows",marker=dict(color='cornflowerblue'))
bar2 = go.Bar(x=vc2['release_year'],y=vc2['count'],name="Movies",marker=dict(color='brown'))
data = [bar1,bar2]

fig = make_subplots(rows=2, cols=1, shared_xaxes=False)
fig.add_trace(bar1,row=1,col=1)
fig.add_trace(bar2,row=2,col=1)

fig.update_layout(title_text="TV Show, 영화 발매 증가 추세")
fig.show()

영화 데이터가 2019년도에 갑자기 줄어들었다. 우연의 일치일까?


어떤 달에 많이 업로드될까?

더보기
tv = d1["date_added"].dt.month.value_counts().reset_index()
tv.columns = ['month','count']
tv['percent'] = tv['count'].apply(lambda x : 100*x/sum(tv['count']))
tv.sort_values('month')

movie = d2["date_added"].dt.month.value_counts().reset_index()
movie.columns = ['month','count']
movie['percent'] = movie['count'].apply(lambda x : 100*x/sum(movie['count']))
movie.sort_values('month')

trace1 = go.Bar(x=tv['month'],y=tv['count'],name='TV Shows',marker=dict(color="cornflowerblue"))
trace2 = go.Bar(x=movie['month'],y=movie['count'],name='Movies',marker=dict(color='brown'))

fig = make_subplots(rows=2, cols=1, shared_xaxes=False)
fig.add_trace(trace1,row=1,col=1)
fig.add_trace(trace2,row=2,col=1)

fig.update_layout(title_text="어떤 달에 많이 업로드될까?")
fig.show()

# + 날짜와 컨텐츠 발매는 상관성이 있는가?

겨울에 많이들 나오네...


관람등급 등급표

더보기
col = 'rating'

tv = d1[col].value_counts().reset_index()
tv.columns=[col,'count']
tv = tv.sort_values(col)

movie = d2[col].value_counts().reset_index()
movie.columns = [col,'count']
movie = movie.sort_values(col)

trace1 = go.Bar(x=tv[col],y=tv['count'],name='TV Shows',marker=dict(color="cornflowerblue"))
trace2 = go.Bar(x=movie[col],y=movie['count'],name='Movies',marker=dict(color='brown'))

data = [trace1,trace2]

layout = go.Layout(title="관람등급", legend=dict(x=0.1,y=1.1,orientation="h"))
fig = go.Figure(data,layout=layout)
fig.show()

영화는 압도적으로 성인물이 많다.(TV-MA : 17세 미만의 어린이나 청소년이 시청하기에 부적절한 프로그램)

TV는 그나마 비율이 적절하다. (TV-14 : 14세 미만의 어린이가 시청하기에 부적절한 프로그램)


장르

더보기
from collections import Counter
col = 'listed_in'

# 리스트에 저장
categories1 = ", ".join(d1[col]).split(", ")
for i in range(len(categories1)) :
    categories1[i] = categories1[i].strip("TV Shows")
    
categories2 = ", ".join(d2[col]).split(", ")

# 빈도수 측정을 위해 counter 사용
counter_list1 = Counter(categories1).most_common(50)
counter_list2 = Counter(categories2).most_common(50)

labels1 = [_[0] for _ in counter_list1][::-1]
values1 = [_[1] for _ in counter_list1][::-1]

labels2 = [_[0] for _ in counter_list2][::-1]
values2 = [_[1] for _ in counter_list2][::-1]

trace1 = go.Bar(y=labels1,x=values1,orientation='h',name="TV Shows",marker=dict(color='cornflowerblue'))
trace2 = go.Bar(y=labels2,x=values2,orientation='h',name="Movies",marker=dict(color='brown'))

data = [trace1,trace2]

fig = make_subplots(rows=2, cols=1, shared_xaxes=False)
fig.add_trace(trace1,row=1,col=1)
fig.add_trace(trace2,row=2,col=1)

fig.update_layout(title_text="TV Show, 영화 장르 파악")
fig.show()

드라마, 영화 모두 drama, 코미디가 가장 많고 TV는 범죄물이, 영화는 다큐멘터리가 그 다음으로 많다.


넷플릭스에 있는 영화 중 가장 많이 출연한 사람들

더보기
def country_trace(country, flag = "movie"):
    df["from_us"] = df['country'].fillna("").apply(lambda x : 1 if country.lower() in x.lower() else 0)
    small = df[df["from_us"] == 1]
    if flag == "movie":
        small = small[small["duration"] != ""]
    else:
        small = small[small["season_count"] != ""]
    cast = ", ".join(small['cast'].fillna("")).split(", ")
    tags = Counter(cast).most_common(25)
    tags = [_ for _ in tags if "" != _[0]]

    labels, values = [_[0]+"  " for _ in tags], [_[1] for _ in tags]
    trace = go.Bar(y=labels[::-1], x=values[::-1], orientation="h", name="", marker=dict(color="olivedrab"))
    return trace

from plotly.subplots import make_subplots
traces = []
titles = ["United States", "","India","", "United Kingdom", "Canada","", "Spain","", "Korea"]
for title in titles:
    if title != "":
        traces.append(country_trace(title))

fig = make_subplots(rows=2, cols=5, subplot_titles=titles)
fig.add_trace(traces[0], 1,1)
fig.add_trace(traces[1], 1,3)
fig.add_trace(traces[2], 1,5)
fig.add_trace(traces[3], 2,1)
fig.add_trace(traces[4], 2,3)
fig.add_trace(traces[5], 2,5)

fig.update_layout(title="많이 출연한 사람",height=1200, showlegend=False)
fig.show() 

한국ㅋㅋㅋㅋㅋㅋㅋㅋㅋㅋ 이경영 1위ㅋㅋㅋㅋㅋㅋㅋㅋㅋㅋㅋㅋㅋㅋ 어쉉쉉!!!!


넷플릭스에 있는 영화 중 가장 많은 작품이 있는 감독들

더보기
def country_trace(country, flag = "movie"):
    df["from_us"] = df['country'].fillna("").apply(lambda x : 1 if country.lower() in x.lower() else 0)
    small = df[df["from_us"] == 1]
    if flag == "movie":
        small = small[small["duration"] != ""]
    else:
        small = small[small["season_count"] != ""]
    cast = ", ".join(small['director'].fillna("")).split(", ")
    tags = Counter(cast).most_common(25)
    tags = [_ for _ in tags if "" != _[0]]

    labels, values = [_[0]+"  " for _ in tags], [_[1] for _ in tags]
    trace = go.Bar(y=labels[::-1], x=values[::-1], orientation="h", name="", marker=dict(color="#66cdaa"))
    return trace

from plotly.subplots import make_subplots
traces = []
titles = ["United States", "","India","", "United Kingdom", "Canada","", "Spain","", "Korea"]
for title in titles:
    if title != "":
        traces.append(country_trace(title))

fig = make_subplots(rows=2, cols=5, subplot_titles=titles)
fig.add_trace(traces[0], 1,1)
fig.add_trace(traces[1], 1,3)
fig.add_trace(traces[2], 1,5)
fig.add_trace(traces[3], 2,1)
fig.add_trace(traces[4], 2,3)
fig.add_trace(traces[5], 2,5)

fig.update_layout(title="이름이 많이 있는 감독",height=1200, showlegend=False)
fig.show() 

넷플릭스의 아들 봉준호... 나머지 영어 이름들은 안찾아서 모르지만 공동 감독이지 않을까..하는 마음


EDA_Netflix.ipynb
1.10MB

더 자세한 내용은 위의 파일로 확인하길!


simple_hg.csv
0.00MB
challenger.csv
0.00MB


1
2
3
4
5
6
7
8
9
10
11
12
13
14
15
16
17
# 탄닌(영양제) 함유량과 애벌레 성장 간의 관계
advertising <- read.csv('c:/data/simple_hg.csv',header=T)
advertising
 
plot(input~cost,data=advertising,pch=21,col='blue',bg='red')
 
regression <- lm(input~cost,data=advertising)
 
abline(regression,col='pink')
title("광고비가 매출에 미치는 영향")
 
residual <- predict(regression,cost=cost)
residual
 
join <- function(i)
  lines(c(cost[i],cost[i]),c(input[i],yhat[i]), col="black")
sapply(1:length(residual),join)
cs


1
2
3
4
5
6
7
8
9
10
11
12
13
14
15
16
17
18
19
# 온도가 O형링 파손수에 끼치는 영향
launch <- read.csv('c:/data/challenger.csv',header=T)
names(launch)
# distress_ct : O형링 파손수
# temperature : 온도
# field_check_pressure : 압력
# flight_num : 비행기 번호
 
 
# 회귀식 만들기
<- lm(distress_ct~temperature,launch)
#     y축          x축
# = lm(formula=distress_ct~temperature,data=launch)
 
 
# launch 데이터와 회귀식 그래프에서 보이기
plot(distress_ct~temperature,data=launch,col='red',bg='red',pch=21)
abline(m,col='blue')
title("온도가 O형링 파손에 미치는 영향")
cs


mushrooms.csv
1.17MB


1
2
3
4
5
6
7
8
9
10
11
12
13
14
15
16
17
18
19
20
21
22
23
24
25
26
27
28
29
30
31
32
33
34
35
36
37
38
39
40
41
42
43
44
45
46
47
48
# 규칙기반 알고리즘을 이용하여 식용버섯과 독버섯 분류하기 (oneR)
mushroom <- read.csv('c:/data/mushrooms.csv',header=T,stringsAsFactors = T)
train_cnt <- round( 0.75 * dim(mushroom)[1]) # 6093
 
# shuffle
set.seed(11)
train_index <- sample(1:dim(mushroom)[1], train_cnt, replace=F)
 
# train (75%) / test (25%)
mushroom_train <- mushroom[train_index,  ]
mushroom_test  <- mushroom[-train_index, ]
 
# oneR로 모델 생성
install.packages("OneR")
library(OneR)
 
model1 <- OneR(type~. ,  data=mushroom_train)
model1
summary(model1)
 
# 예측
result1 <- predict( model1, mushroom_test[   , -1] )
 
# 정확도
library(gmodels)
= CrossTable( mushroom_test[ , 1],  result1)
x$prop.tbl[1]+x$prop.tbl[4# 0.9862137
 
 
##########################################################
# 규칙기반 알고리즘을 이용하여 식용버섯과 독버섯 분류하기 (JRip)
# JRip로 모델 생성
install.packages("RWeka")
library(RWeka)
 
model2 <- JRip(type~ ., data=mushroom_train)
model2
 
summary(model2) # 작은 이원교차표가 하나 보임
 
# 예측
result2 <- predict( model2, mushroom_test[   , -1] )
 
# 정확도
library(gmodels)
<- CrossTable( mushroom_test[ , 1],  result2)  
x$prop.tbl[1]+x$prop.tbl[4# 1
 
cs


credit.csv
0.09MB


1
2
3
4
5
6
7
8
9
10
11
12
13
14
15
16
17
18
19
20
21
22
23
24
25
26
27
28
29
30
31
32
33
34
35
36
37
38
39
40
41
42
43
44
45
46
47
48
49
50
51
52
53
54
55
56
# 의사결정트리 알고리즘을 이용하여 은행 대출 채무 이행/불이행 여부 예측
credit = read.csv('c:/data/credit.csv',header=T,stringsAsFactors = T)
 
# 데이터 형태 확인
str(credit) # 수치형, 명목형 섞여있음
 
# 데이터 분류 (caret 사용)
# install.packages('caret')
library(caret)
set.seed(5)
intrain = createDataPartition(credit$default,p=0.9,list=F)
 
# train(90%) / test(10%)
credit_train = credit[intrain,]
credit_test = credit[-intrain,]
 
nrow(credit_train) # 900
nrow(credit_test) # 100
 
# 의사결정트리 모델 생성
library(C50)
credit_model = C5.0(default~.,data=credit_train,trials=24# 24 : 0.87
credit_result = predict(credit_model,credit_test[,-17])
 
# 이원 교차표로 결과 확인
library(gmodels)
= CrossTable(credit_test[,17],credit_result)
 
# install.packages('rpart')
# install.packages('rpart.plot')
library(rpart)
library(rpart.plot)
 
# 의사결정트리 시각화
rpartmod = rpart(default~., data=credit_train, method='class')
rpart.plot(rpartmod)
 
x$prop.tbl[1]+x$prop.tbl[4# 0.87
 
# 어떤 trial 값이 가장 정답률이 높은가?
temp = c()
num = c()
for (i in 1:100) {
  num = append(num,i)
  credit_model = C5.0(default~.,data=credit_train,trials=i)
  credit_result = predict(credit_model,credit_test[,-17])
  x = CrossTable(credit_test[,17],credit_result)
  g3 = x$prop.tbl[1]+x$prop.tbl[4]
  temp = append(temp,g3)
}
 
result = data.frame("trials"=num,"정확도"=temp)
 
library(plotly)
plot_ly(x=~result[,"trials"],y=~result[,"정확도"],type='scatter',mode='lines') %>%
  layout(xaxis=list(title="trials"),yaxis=list(title="정확도"))
cs


의사결정트리가 실제로 분류되는 모습


+) 호기심에 미친 나! 어떤 seed값과 trial값이 가장 좋은 결과를 만들어낼까? 2중 for 문 돌려보자!

1
2
3
4
5
6
7
8
9
10
11
12
13
14
15
16
17
18
19
20
21
22
23
24
25
26
27
28
29
30
31
32
33
34
35
36
37
38
39
40
41
42
43
44
45
# 의사결정트리 알고리즘을 이용하여 은행 대출 채무 이행/불이행 여부 예측
credit = read.csv('c:/data/credit.csv',header=T,stringsAsFactors = T)
 
# 데이터 형태 확인
str(credit) # 수치형, 명목형 섞여있음
  
library(caret)
library(C50)
library(gmodels)
 
# 어떤 trial값과 seed값이 가장 정답률이 높은가?
temp = c()
num = c()
seed_num = c()
for (j in 5:6) {
  for (i in 1:100) {
    set.seed(j)
    intrain = createDataPartition(credit$default,p=0.9,list=F)
    
    # train(90%) / test(10%)
    credit_train = credit[intrain,]
    credit_test = credit[-intrain,]
  
    num = append(num,i)
    credit_model = C5.0(default~.,data=credit_train,trials=i)
    credit_result = predict(credit_model,credit_test[,-17])
    x = CrossTable(credit_test[,17],credit_result)
    g3 = x$prop.tbl[1]+x$prop.tbl[4]
    temp = append(temp,g3)
    seed_num = append(seed_num,j)
  }
}
 
# seed값과 trials에 따른 정확도를 보여주는 result라는 테이블을 만들어다.
result = data.frame("trials"=num,"seed"=seed_num,"정확도"=temp)
result
 
# 제일 좋은 조건 한번에 보기
result[result$정확도==max(result['정확도']),]
 
# 근데 lines 그래프로는 seed값을 어떻게 보여줘야 될 지 모르겠네 ^^
# 아는 분은 댓글로 좀 알려주세요 ^0^
library(plotly)
plot_ly(x=~result[,"trials"],y=~result[,"정확도"],type='scatter',mode='lines') %>%
  layout(xaxis=list(title="trials"),yaxis=list(title="정확도"))
cs


개판... set.seed(5) / trials = 24 인게 87%로 가장 낫다!


skin.csv
0.00MB


1
2
3
4
5
6
7
8
9
10
11
12
13
14
15
16
17
18
19
20
21
22
23
24
25
26
27
28
29
30
31
32
33
34
35
36
37
38
39
40
41
42
43
44
45
46
47
48
49
50
51
# 의사결정트리 알고리즘을 이용하여 화장품 구매 고객 예측하기
# skin 데이터 갖고 오기 (C50 쓰려면 컬럼명,데이터 모두 영어여야함)
skin <- read.csv("c:/data/skin.csv", header=T ,stringsAsFactors = TRUE)
str(skin)
 
nrow(skin) # 30
 
# TEST용 하나 제외
skin_real_test_cust <- skin[30, ]
skin_real_test_cust
 
# TEST용을 제외하고 새롭게 skin2 생성
skin2 <-  skin[ 1:29, ] 
nrow(skin2) # 29
 
skin2 <- skin2[ , -1# 고객번호 제외
 
# shuffle
set.seed(0)
skin2_shuffle <- skin2[sample(nrow(skin2)),]
 
train_num <-  round(0.7 * nrow(skin2_shuffle), 0# 20
 
# train(70%) / test(30%)
skin2_train <- skin2_shuffle[1:train_num,]  
skin2_test  <- skin2_shuffle[(train_num+1) : nrow(skin2_shuffle),] 
 
nrow(skin2_train)  # 20
nrow(skin2_test)   #  9 
 
# 의사결정트리 패키지 설치
# install.packages("C50")
library(C50)
 
# 의사결정트리는 trials와 seed로 정확도 조절
skin_model <- C5.0(cupon_react~.,data=skin2_train,trials=10,replace=T)
skin_model # skin 데이터는 데이터양이 너무 적어서 trials=1번밖에 못 도는 것 확인 가능
 
# 정답 / 예측값 확인
skin2_result <- predict(skin_model , skin2_test[  , -6])
<- data.frame(skin2_result,skin2_test[6])
table(x)
 
skin3_result <- predict(skin_model,skin_real_test_cust)
data.frame(skin3_result,skin_real_test_cust[7])
 
library(gmodels)
CrossTable( skin2_test[  , 6],  skin2_result )
 
per <- CrossTable( skin2_test[  , 6],  skin2_result )
per$prop.tbl[1]+per$prop.tbl[4# 0.777778
cs


flu.csv
0.00MB


1
2
3
4
5
6
7
8
9
10
11
12
13
14
15
16
17
18
19
20
21
22
23
24
25
26
27
28
29
30
31
32
33
34
35
36
flu_func <- function(){
  library(e1071)
  
  flu_insert <- read.csv("c:/data/flu.csv", header=T, stringsAsFactors=TRUE)
  
  # 대문자 변경
  flu_insert$headache = toupper(flu_insert$headache)
  
  # 환자 번호 제거
  flu <- flu_insert[-1]
  
  nrow(flu) # 8
  
  train <- flu[1:8,]
  
  model <- naiveBayes(flue~., data=train , laplace=0)
  model
  
  # 증상 입력받기 (대문자로 써야함)
  a <- readline(prompt = '오한이 있습니까?'# Y
  b <- readline(prompt = '콧물이 있습니까?'# N
  c <- readline(prompt = '두통이 있습니까?'# MILD
  d <- readline(prompt = '열이 있습니까?'# N
  
  # data frame으로 만들기
  test = data.frame(chills=a,runny_nose=b,headache=c,fever=d,stringsAsFactors = T)
  test
  result <- predict( model, test,type="raw"# type="raw" 로 하면 라벨 비율이 나옴
  # result[1]은 N일 확률, result[2]는 Y일 확률을 의미
  # type을 명시하지 않으면 확률이 50% 초과인 라벨을 출력
  
  return(paste('독감일 확률이',round(result[2]*100,digits=1),'% 입니다.'))
  # "독감일 확률이 24.5 % 입니다."
}
 
flu_func()
cs


movie.csv
0.00MB
movie_test.csv
0.00MB


1
2
3
4
5
6
7
8
9
10
11
12
13
14
15
16
17
18
19
20
21
22
23
24
25
26
27
28
29
30
31
32
33
34
35
36
37
38
39
40
41
42
43
44
45
46
47
48
49
50
51
#1. 워킹 디렉토리 지정
setwd("c:\\data")
 
# 2. 라이브러리 선언
library(e1071)
 
# 3. 데이터 로드
movie <- read.csv("movie.csv", header=T, stringsAsFactors=TRUE)
str(movie) # factor로 변환되었는지 확인
nrow(movie) # 39
 
# 4. 컬럼명을 영어로 변경
View(movie)
colnames(movie) <- c("age","gender","job","marry","friend","m_type")
 
View(movie)
 
# 5. train(38) / test(1)
train <- movie[1:38,]
test <- movie[39,]
 
train
test
 
# 6. 나이브 베이즈로 학습
#                     훈련데이터       라벨
model <- naiveBayes(train[ ,1:5], train$m_type , laplace=0)
# +) 나이브 베이즈를 이렇게도 학습 시킬 수 있음
# model <- naiveBayes(m_type~.,data=train,laplace=0) # m_type~. : 예측하고자 하는 라벨
 
#7. 예측 결과
result <- predict(model, test[,1:5])
# 그냥 test 데이터만 줘도 m_type은 predict를 위한 학습 데이터에서 사용되지 않기 때문에 상관은 x
result
 
test2 <- data.frame(age='20대', gender='여', job='IT', marry='NO',friend='NO')
result <- predict(model, test2)
result # 로맨틱
 
test3 <- data.frame(age='20대', gender='남', job='학생', marry='NO',friend='NO')
result <- predict(model, test3)
result # 코미디
 
# 입력 받은 파일 예측하기
fname <- file.choose()
test4 <- read.csv(fname,header=T,stringsAsFactors=T)
# 컬럼명을 똑같이 해줘야 제대로 결과를 낼 수 있음 (따라서 순서 상관 x)
names(test4) <- c("age","gender","job",'marry','frined')
 
result <- predict(model,test4)
result # 스릴러
cs


mushrooms.csv
1.17MB


자료형태

범주형

명목형

순서형

수치형

이산형

연속형


1
2
3
4
5
6
7
8
9
10
11
12
13
14
15
16
17
18
19
20
21
22
23
24
25
26
27
28
29
30
31
32
33
34
35
36
37
38
39
40
41
42
43
44
45
46
47
48
49
50
51
52
53
54
55
56
57
58
59
60
61
62
# 나이브베이즈알고리즘을 이용하여 식용버섯과 독버섯 분류하기
mushroom = read.csv("c:/data/mushrooms.csv",header=T,stringsAsFactors = T)
 
# factor로 변환하는 이유
# factor로 변환하지 않으면 프로그램이 문자를 단지 형(string)으로만 인식하지만
# factor로 변환하면 각각의 문자를 범주로 인식하기 때문에 나이브 베이즈를 사용하는 명목형 데이터는 Factor 형태여야 함
 
# R은 테이블로도 데이터를 확인할 수 있음
View(mushroom)
 
# 결측치 확인
colSums(is.na(mushroom))
 
dim(mushroom) # 8124(데이터 개수) 23(컬럼 개수)
 
# 데이터 shuffle
set.seed(1)
train_cnt <- round( 0.75*dim(mushroom)[1] )
train_cnt # 6093
 
# mushroom의 1부터 8124 중 6093개(train_cnt)만큼 임의의 숫자를 뽑음
train_index <- sample( 1:dim(mushroom)[1], train_cnt, replace=F)
train_index
 
# 임의로 뽑힌 6093개의 인덱스들을 추출해서 train / test 로 나눔
mushroom_train <- mushroom[ train_index, ]
mushroom_test <- mushroom[-train_index, ]
 
nrow(mushroom_train) #6093
nrow(mushroom_test) #2031 
 
# mushroom_train 확인
str(mushroom_train)
 
# 없다면 'e1071 패키지 깔기'
# install.packages('e1071')
# 나이브 베이즈 알고리즘 사용
library(e1071)
model1 <- naiveBayes(type~.,data=mushroom_train) # type~. : 예측하고자 하는 컬럼 의미
model1
result1 <- predict( model1, mushroom_test[  , -1] )
result1 
 
library(gmodels)
CrossTable(mushroom_test[ ,1], result1)
 
# 어떤 laplace 값이 정확도가 가장 높을까?
temp = c()
laplace_num = c()
for (i in 1:10) {
   laplace_num = append(laplace_num,i*0.001)
    mushroom_test_pred = naiveBayes(type~ . ,  data=mushroom_train, laplace=i*0.001)
    result2 <- predict(mushroom_test_pred, mushroom_test[ , -1] )
    g2 <- CrossTable(mushroom_test[ ,1], result2)
    g3 <- g2$prop.tbl[1]+g2$prop.tbl[4]
    temp = append(temp,g3)
}
 
result = data.frame("laplace"=laplace_num,"정확도"=temp)
library(plotly)
plot_ly(x=~result[,"laplace"],y=~result[,"정확도"],type='scatter',mode='lines') %>%
  layout(xaxis=list(title="laplace값"),yaxis=list(title="정확도"))
cs


+ Recent posts